

Dental Business Dashboard
Business Intelligence (BI) platforms are visual data analysis tools that have become the backbone of successful businesses today! Our Dental Business Dashboard App is a business intelligence and analytics solution that will allow you to visualize the financial health of the dental practice. The Dental Business Dashboard App transforms the vast and complex data found in the practice management software by simplifying it into easy to visualize graphs. Thus, empowering you to see trends, patterns, and providing ways to monitor your business performance at a glance. We combine your business goals, Key Performance Indicators (KPIs), and dental benchmarks to visualize how effectively your practice is achieving key business objectives. Thus, permitting you to focus resources on the areas that require attention and to support critical business decisions - based on data-driven analysis.
Use our Dental Business Dashboard App and Services as an “additional and unbiased set of eyes” to independently verify, analyze and visualize the financial health of your practice to enabling you and your office manager to focus on day-to-day operations. Some owner-dentists prefer not to involve their team members (i.e., office manager) in their business. Other owner-dentists want to minimize embezzlement and want us to monitor their business activities. In such cases, we use the internet to discreetly and remotely access their practice management applications outside their office hours (i.e., weekends, nights). We then review and analyze data and communicate our findings only to the owner-dentist.
If you do not have the tools to measure the financial health of your business, you cannot improve on it!

Visualize your data using charts and indicators
In addition to visually monitoring the monthly production of the practice, the Key Performance Indicator (KPI) provides a focus for strategic and operational improvement for the practice. In addition, we can incorporate a break-even point (i..e, Minimum), the average monthly production (i.e., Base), and the practice’s goal (i.e., Target). This type of graph supports the critical thinking process by creating an analytical basis for decision making.
Summarize your data using scorecards
Scorecards are used to display a summary of a single metric and are commonly used to visualize key performance indicators: some variable that measures the relative health or performance of your business or area of activity. For example, the scorecard above summarizes the average yearly percent collection . In addition to comparing the percent collections performance to the previous year, we can include benchmarks, as well as visually see the color of the scorecard to alert us (i.e., RED = Warning, YELLOW = caution, GREEN = acceptable).


CLICK HERE TO GO AND PLAY WITH THE SAMPLE BUSINESS DASHBOARD
Track performance
By combining Line Charts with Funnel Indicators, we can create a different visual representation of the information to determine if the data falls within a predetermined Goals (or Benchmarks). The chart above allows us to evaluate the daily production performance for a provider (i.e., dotted blue line with points). The chart clearly reveals the production trend for this provider. The Funnel Indicator values were based on the break-even point (i.e., Red line = Minimum) and production goals calculated to reach profits (i.e., RED = Break-Even Point; YELLOW = average or baseline; GREEN = Desired Target).
Monitor Performance Over Time
Data points for insurance aging were collected every week to visualize performance. By creating this type of charts you can monitor performance of any system over time (and team members responsible for such tasks). In this example, you can visually see that the Insurance accounts for the 61-90 Days and Over 90 Days were high in 2015, and the Team member you hired to do this task did a great job until she quit in July 2017. Since you are unable to find a responsible and knowledgeable person responsible to do this task, the insurance aging amounts have increased.

CLICK HERE TO GO AND PLAy WITH THE SAMPLE BUSINESS DASHBOARD
Our Service
The Dental Business Dashboard is a cloud-based service where the data from your practice management software and then transformed to make the analysis and reporting process simpler. The data is presented graphically, in a way that is most useful to you (the Dental Business Leader, Consultant), to reveal trends and visualize the financial health of your practice.
SETUP FEE - there is a one-time-only setup fee. The amounts depends on the type of Dental Business Dashboard service you select (see the Pricing Information below). This fee includes: 1) Information Gathering, including analysis of your business requirements, goal/targets); 2) Planning, which includes the creation of a sitemap sketch of the databases with Dashboard components; 3) programming the algorithms and building functions for your custom Dental Business Dashboard; 4) Designing the page layouts, and getting your feedback; 5) Remotely accessing your practice management software to obtain data, to populate the databases and visualize it (i.e., create the charts); 6)Testing the Dental Business Dashboard with your data; 7) Reviewing the functionality of the Dental Business Dashboard with you (and get your feedback) and; 8) Launching the Dental Business Dashboard.
MONTHLY SERVICE FEE - there is a monthly service fee, which depends on the Dental Business Dashboard service you select (see the Pricing Information below). This fee includes: 1) extracting data from your practice management software on a monthly basis to update your Dental Business Dashboard application; 2) Analyzing the data, and; 3) Phone consultations (i.e., coaching how to enhance production, collections, reduce accounts receivables based on analysis of your data).
REMOTE ACCESS - in order to run reports and extract data for your Dental Business Dashboard (strictly following HIPAA Compliance and Regulations) we’ll need your permission, allowing us to set up unattended remote access to your practice management application. Additionally, remote access can be used to do training and coaching, when required.
SECURITY - to help maintain the highest level of security, the user's gmail account is used to restrict access to the Dental Business Dashboard. You can authorize who views the information in your Dental Business Dashboard (i.e, (i.e, CPA, Manager, Hygienist, Consultant).
Pricing

Pricing may change without notice. **Monthly updates. ***Quarterly updates of demographic data and will depend on what we can extract from your practice management software. For Add-Ons please inquire. If you have data, you can visualize it!
Pricing may change without notice. *Weekly updates. **Monthly updates. ***Quarterly updates of demographic data and will depend on what we can extract from your practice management software. For Add-Ons please inquire. If you have data, you can visualize it!

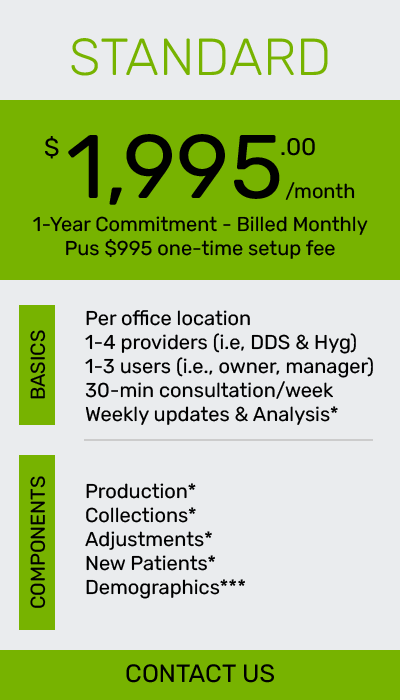
Pricing may change without notice. Daily production data may be uploaded by the dental practice (i.e., manager). *Weekly updates and analysis. **Monthly updates and analysis. ***Quarterly updates and analysis of demographic data and will depend on what we can extract from your practice management software. For Add-Ons please inquire. If you have data, you can visualize it!
NOTE: If you are a Dental Consultant interested in using our Dental Business Dashboard App as part of your services, please feel free to send me a note and tell me about your consulting services, and ask us about our Consultant’s Pricing.